- The types of advanced tools available to you
- Some use cases for advanced analytics
- An introduction to website testing
For many small websites, the items outlined in chapter 13 would be enough for you to work out what your visitors are actually doing on your website and how you can improve it as a result (although you will still benefit from a lot of the more advanced features displayed here). However, once your website, business or organisation starts scaling you will definitely want to use many of these more advanced tools/techniques to answer more advanced questions about your visitors.
This is not a guide, more of a lay of the land, so that you are aware of what the options are.
Tools for iterative improvement
These can be classified into the following broad categories:
- Marketing analytics tools which help you track user behaviour on your website. Examples include Google Analytics, Matomo and Yandex Metrika. They typically focus a user’s journey from your marketing channels to engaging on your website and becoming a customer, although most can be configured to go beyond this.
- Product analytics tools which help track user behaviour in your web-based app, or other account-based service. Examples include Heap and Mixpanel. These are typically more focussed on what happens after someone becomes a customer, although most can be configured to be more holistic.
- Heat mapping/session recording tools which record either specific user sessions (so you can see how people actually behave in real-time) or aggregate multiple sessions into a single visualisation. Examples include Hotjar, Clarity and Crazy Egg.
- Qualitative feedback/research tools which solicit surveys and other feedback from your website visitors. Examples include Hotjar and Typeform.
- Testing labs which help create A/B tests and multivariate tests, personalise your website and more (see the section below). Examples include Visual Website Optimizer and Zoho Pagesense.
More advanced analytics
Once you’ve implemented the items from chapter 13, here’s what’s next. (In terms of implementing these you can check out our knowledge base or plenty of other great blogs, social media groups and YouTube channels)
- Adding more data to your analytics account. For example in Google Analytics you can add:
- Cost data from ad campaigns to see the return on investment (ROI) of each platform
- Custom dimensions with additional data about the visitor (eg. industry) or page (eg. topic/category)
- Integration with your CRM so that you can push offline conversions into your analytics tool, which will let you see the post-lead ROI of different marketing channels
- UserID, which sends the ID for logged-in users with every item tracked, which will let you see a more user-centric view of your data (for example a person logging in across multiple devices will be considered the same)
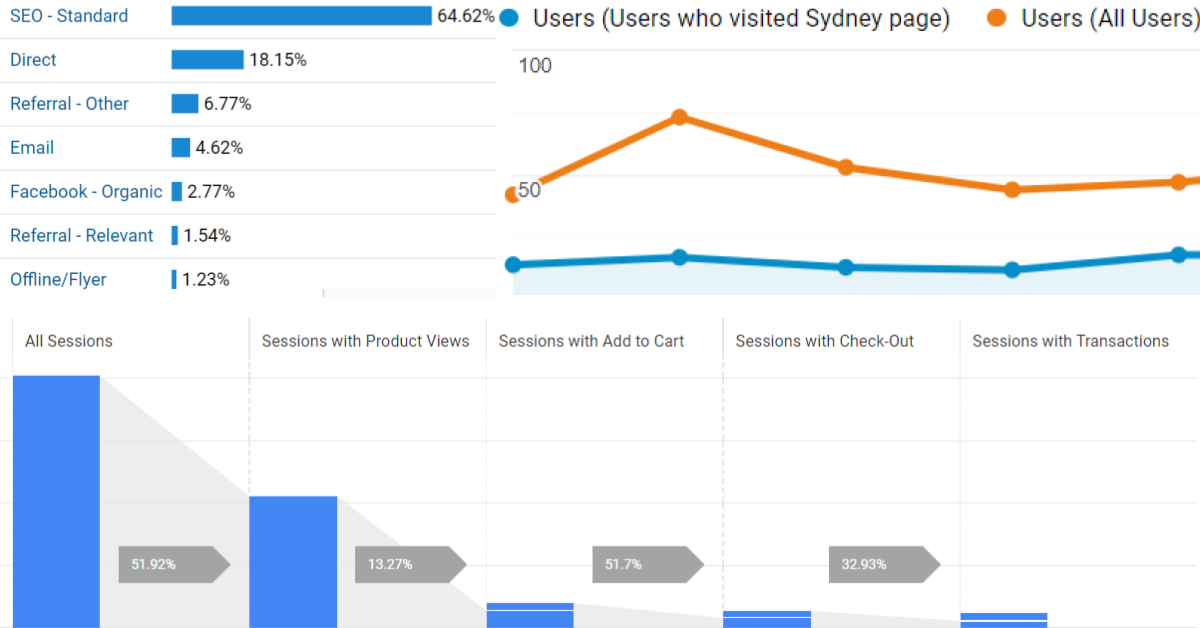
- Most analytics tools allow you to map user actions to standard parts of the online shopping funnel (ie. view product, add to cart, checkout stages, complete purchase) to see where people are dropping off
- Simplifying reports by grouping multiple items into one. This is most relevant for larger websites, for example:
- Grouping pages into categories or other groups so that the number of items to look at becomes manageable (eg. having all blog posts as a single group)
- Grouping traffic sources into manageable buckets of marketing channels (eg. having paid social as its own bucket).
- Identifying specific segments of your visitors in order to compare the difference between them. This is often what surfaces the most useful insights. For example, how does the conversion rate of people who read at least 2 blog posts compared to those who read just 1 post vs none at all? These will typically be very custom for your website.
- Funnel analysis, to identify where people enter and drop off for a user flow that has a fairly specific order (eg. the product – cart – checkout – confirmation paradigm of most ecommerce websites).
- Attribution modelling, to develop a way to properly assign credit for conversions to your marketing channels which takes into account the fact that many visitors may be going to your website multiple times (using multiple marketing channels) before they convert. Most tools will by default either grant full credit to the last channel before conversion, or to the ad platform that the tool is representing (eg. Facebook Ads for Facebook Pixel) but this is rarely the most useful view of the data.
- If you generate leads that convert offline then integration with your CRM is important
- If you sell a product, funnel analysis is important
- If your consideration/sales cycle is long then attribution modelling is important
- If you publish a lot of content regularly , grouping pages together by topic is important
Getting started with website testing
- If you’re not performing systematic testing then this means that your website either (A) does not undergo continuous improvement or (B) gets changes/improvements based on the gut feel of you/your CEO/your most vocal customer etc. Neither path is likely to systematically improve your website.
- A systematic testing tool (eg. Visual Website Optimizer) typically uses a platform to randomly assign visitors (or a subset of visitors) to different buckets and present a portion of the website differently, then measure how the different groups respond. You can test things at a very low level (eg. the colour of a button) or medium (eg. an entire page) or even large (a whole multi-page flow or even a website rebrand).
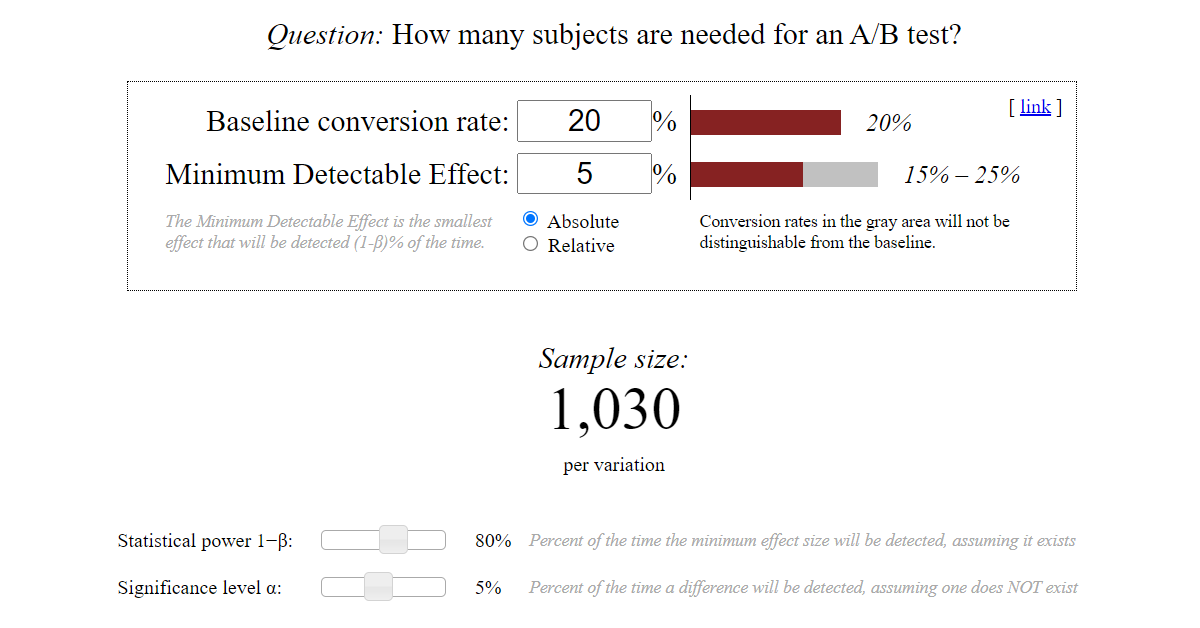
- The only reason not to test something is if your traffic is so low that you are unlikely to get statistically significant results. This is something to be aware of for any experiment – you need a decent amount of visitors. There are plenty of good sample size calculators out there to try, like this one. If your traffic is super low then you may need to stick to qualitative data like website satisfaction surveys.
- Another thing to be aware of is that testing needs to be systematic to have a chance of succeeding. Often we see a website owner get a testing tool, get excited (great!) and then start implementing random tests that pop into their head (not great!). Each test should be driven by a hypothesis and should be about an aspect of the website that has a reasonable chance of being improved based on the data.
- A good hypothesis might be “people are missing the Join Now button so changing the colour to something brighter will highlight it more”. A more general hypothesis like “changing the colour of the button will improve the signup rate” is likely to be easily testable only if your website gets a lot of traffic.
- Larger changes are likely to yield larger results, don’t expect dramatic changes to anything with a button colour change. Similarly you may want to look at your analytics and do some back of the envelope calculations. Even if I doubled the metric I’m optimising for (eg. rate of people clicking on the button), how much difference would it actually make? If only 3% of your visitors go to the page with the form and 1% of those submit the form the answer might be “not much” in which case you would need a very large test audience to statistically find the difference.
- Don’t be discouraged! This isn’t going to be 100% scientific but it is science-like. Which means most of your hypotheses will be wrong and most tests will fail or be inconclusive. This is par for the course.