The GA4 BigQuery export
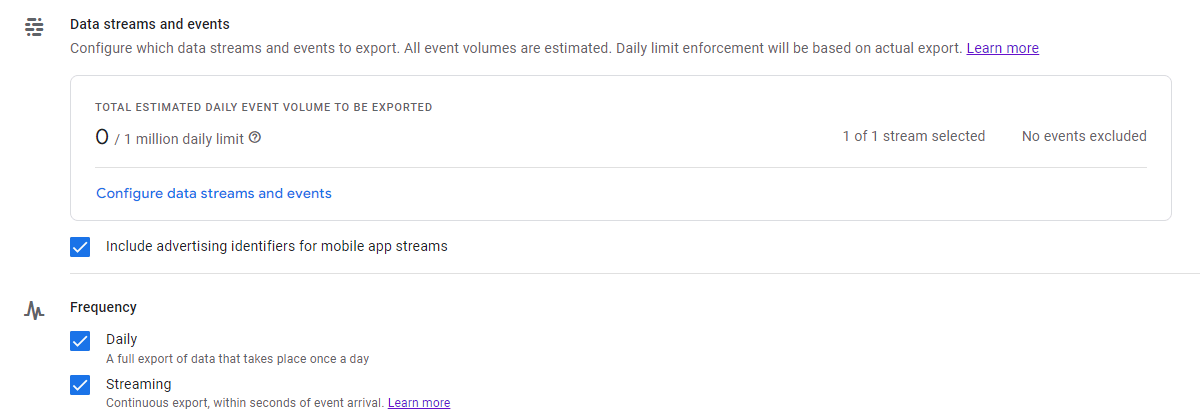
One of the best features of GA4 is that the BigQuery export of the raw data is available for free. For the first time, this allows organisations of all sizes and budgets to perform detailed or advanced reporting and analysis on their website traffic data. You can set this up in GA4 under BigQuery linking:
Data storage is $0.02 per GB per month (see our calculator for more) with the first 10GB free. Processing costs $5-7 per TB of data with the first 1TB free per month. So it’s not free but there’s a very generous free tier that a lot of orgs will completely fit in.
The default table has some issues
Unfortunately, the way Google exports your GA4 data can make for large processing costs:
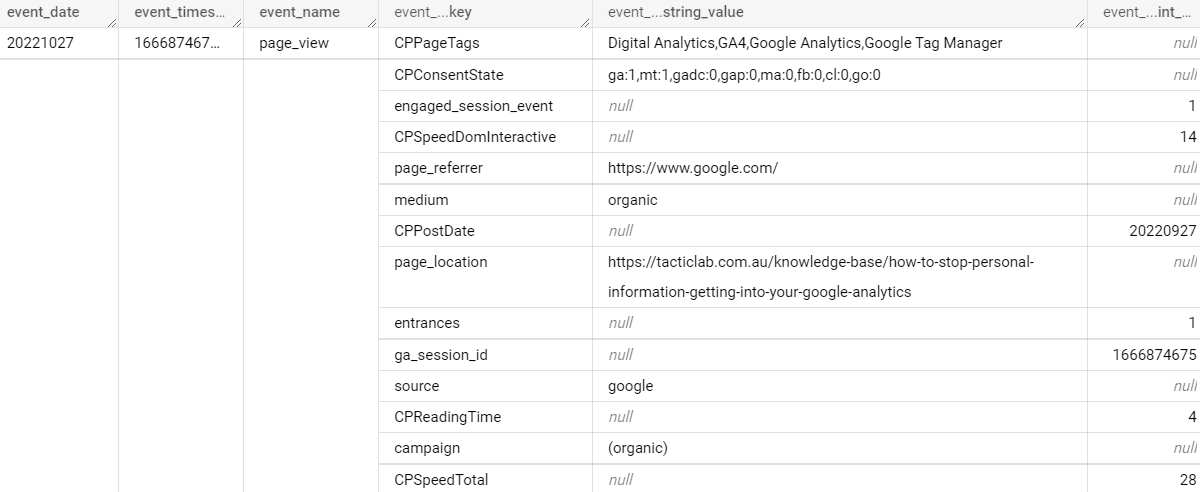
What you see above is part of a single row of data, an event on the Tactic Lab website. The sub-rows like source, entrances and page_referrer are repeated records and come from the parameters you send to GA4. This is a flexible model as you can add more parameters and it still works. But this setup means you can’t address those fields directly in SQL, but will need a subquery with an unnest statement. For example, here’s how to find the top 10 URLs by pageviews for a given day:
SELECT
  (SELECT value.string_value FROM UNNEST(event_params) WHERE key='page_location') AS url,
  COUNT(event_name) AS page_views
FROM `projectname.analytics_ga4id.events_YYYYMMDD`
WHERE event_name="page_view"
GROUP BY url
ORDER BY page_views DESC
LIMIT 10
This isn’t the easiest SQL to write and interpret, but there’s also a performance tradeoff in the highlighted line. It tells BigQuery to expand the event_params field into a mini table and check each of those sub-rows until it finds page_location. Each time a query like this runs, BigQuery will need to look through all the parameters you’ve ever sent.
Improving on the setup
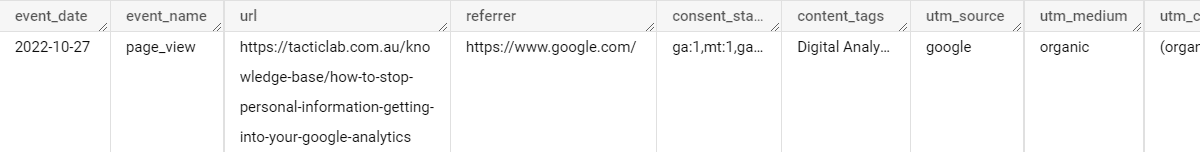
What if the table could be improved? If each parameter that you care about is its own column, BigQuery can go to it directly, ignoring all the other columns. This is exactly the setup we have for clients:
- Every morning a scheduled query runs on the previous day’s data from the Google-created table. It’s an expensive query but only needs to be run once, to split out the parameters into their own columns and writes to the 2nd, flat table.
- Actual analysis is taken from the flat table.
Here’s what the flat table looks for that event looks like, every relevant parameter is its own column:
Below is the same query for the top 10 URLs from a flat table – much simpler!
SELECT url, COUNT(event_name) AS page_views
FROM `projectname.analytics_flat_table.events`
WHERE event_name="page_view"
GROUP BY url
ORDER BY page_views DESC
LIMIT 10
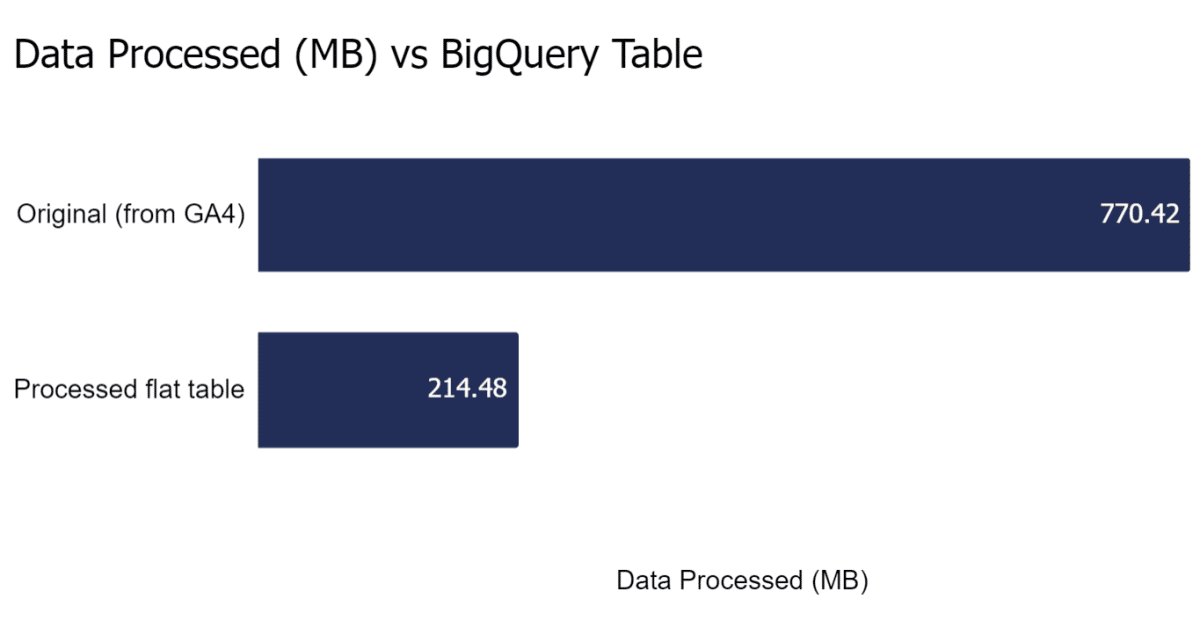
To test performance, we ran some queries to list all unique URLs visited by anyone in 2022 for a large client website and there was a huge difference:
| Unique URLs in 2022 | Original Google Table | New Flat Table | Savings |
|---|---|---|---|
| Data processed (MB) | 770.42 | 214.48 | 72% |
| Elapsed time (s) | 9 | 1 | 89% |
| Slot time consumed (s) | 55 | 46 | 16% |
Are there any trade offs? Yes, a couple:
- By storing events as a flat table, you’re doubling your storage. This shouldn’t be an issue for most organisations, but you could even look at deleting old GA4 tables from the original format as a process.
- If you want to incorporate a new parameter, the scheduled query needs to be updated. This is a quick task though.
If you’d like to set this up but aren’t sure where to start feel free to contact us.

