When you set up Google Analytics, its most basic default metric is the view, which means they just loaded a page.
Does it mean they found the page useful? No.
Does it mean they read anything on the page? No.
Pageviews are a great metric of seeing what pages on your website get the most traffic but not the most attention.
Now in GA4 there is also a metric called engagement time which tracks actual active time, and this is used to derive the engagement rate. But what if you had a custom definition of what you considered an engaged pageview? For example if the user scrolled at least 50% of the page AND stayed for at least 30 seconds. This would provide a useful yes/no question and let you calculate a custom engagement rate. This is not a perfect metric by any means (and you might need to adjust those numbers for your industry/vertical), but it’s a much better proxy for them reading the content than the pageview.
This is made super easy with Google Tag Manager trigger groups.
Here’s how to do it.
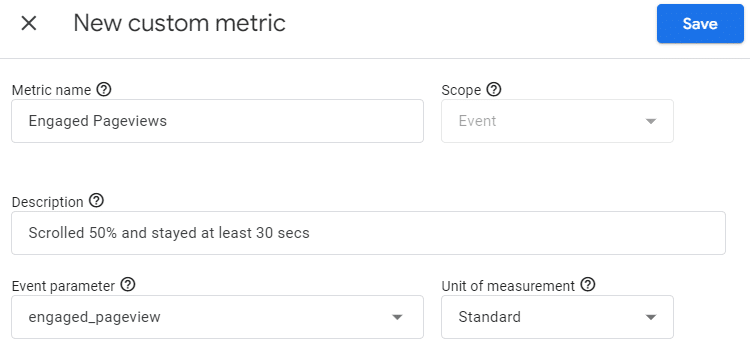
Step 1 – In Google Analytics create a new custom metric called Engaged Pageview with the scope of Event and a custom event parameter.
Here’s how the table should look if you have no other custom metrics:
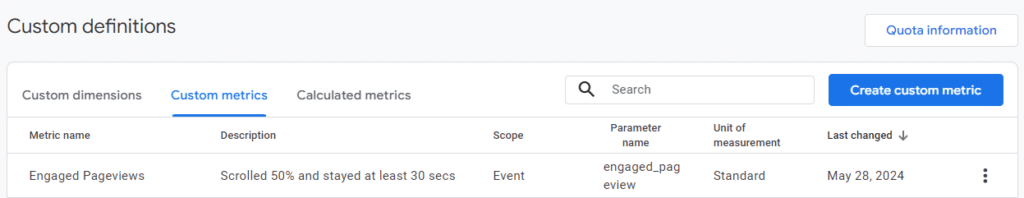
Note the index, in this case, 1.
Step 2 – in Google Tag Manager, create a timer trigger executing once after 30 seconds.
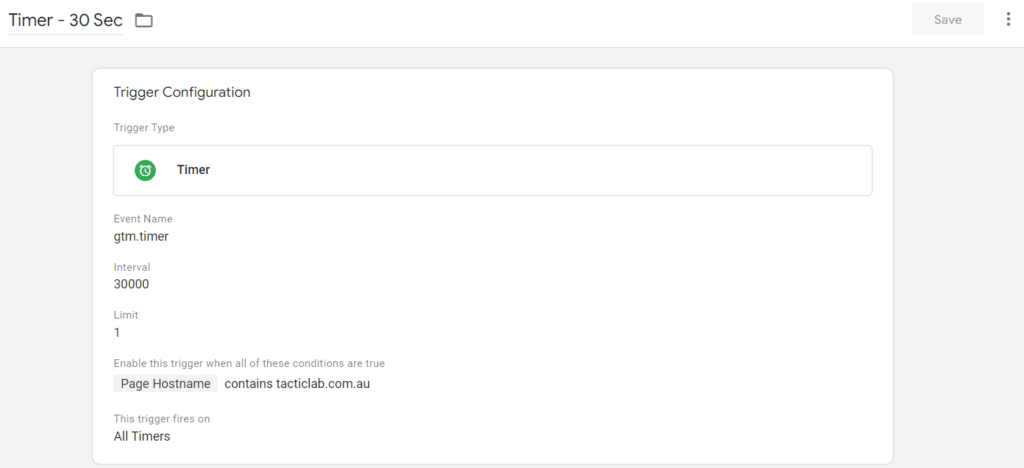
Note that there’s an extra condition you have to specify, if you want to measure engaged pageviews on all pages just set it to something super-generic that all pages on your website will pass.
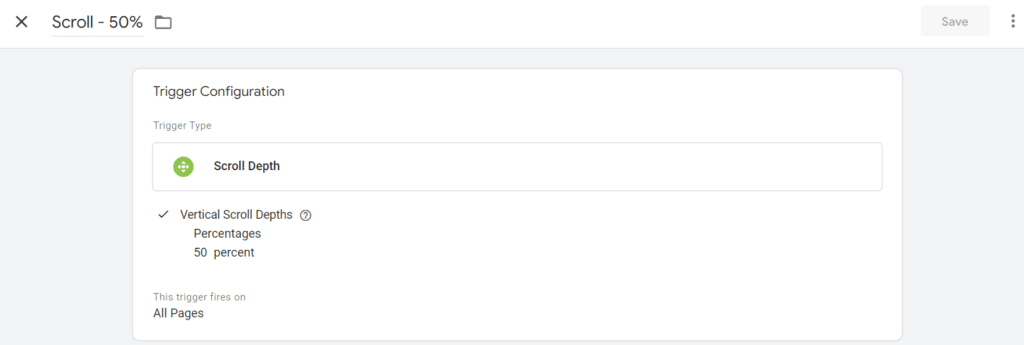
Step 3 – create the scroll trigger
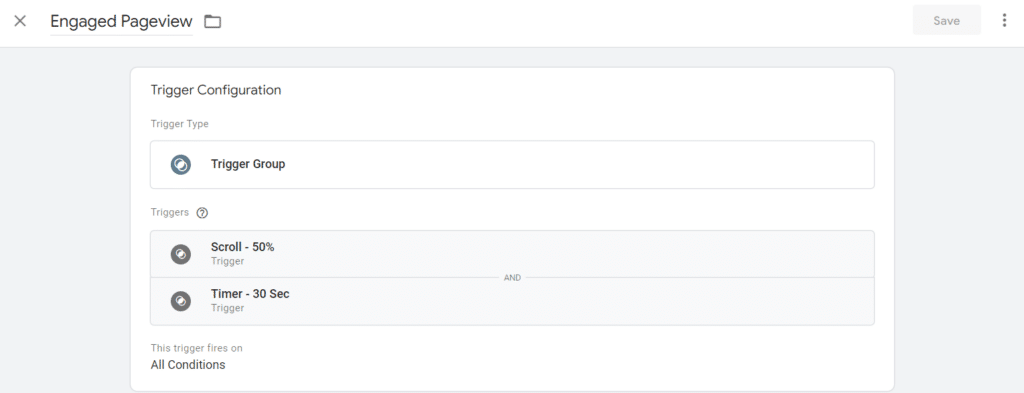
Step 4 – create a trigger group that combines both of the above triggers into one.
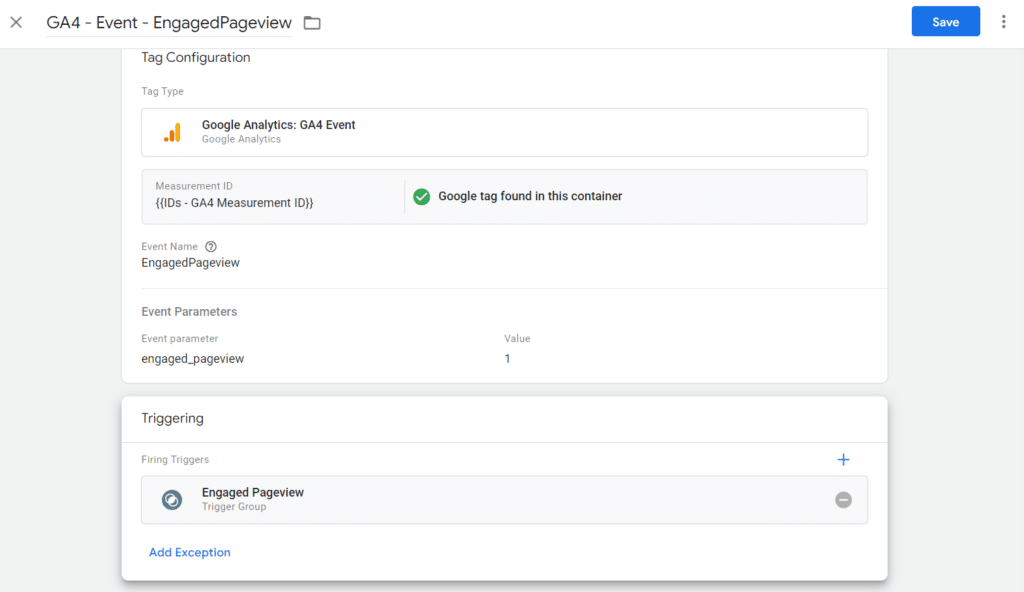
Step 5 – create a GA4 tag that sends an event with the custom parameter set to 1:
Step 6 – in Looker Studio, define a custom field that’s the engagement rate:
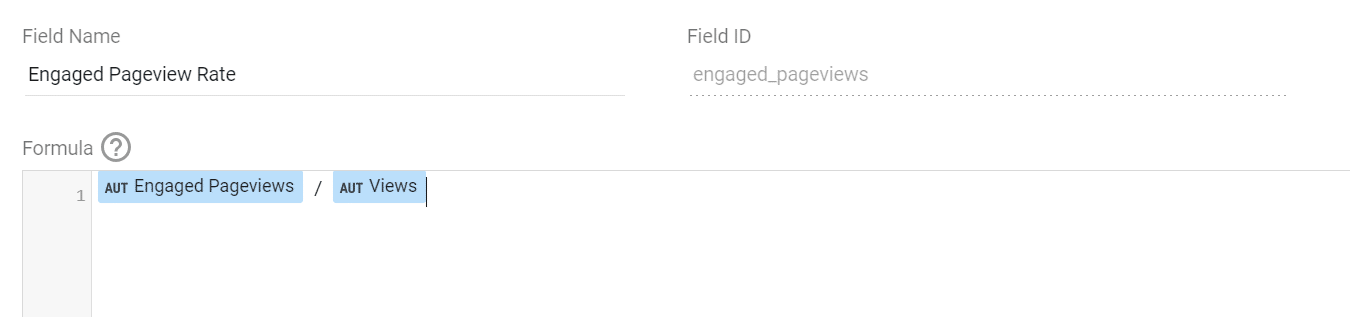
Note that “views” is the GA4 metric for pageviews.
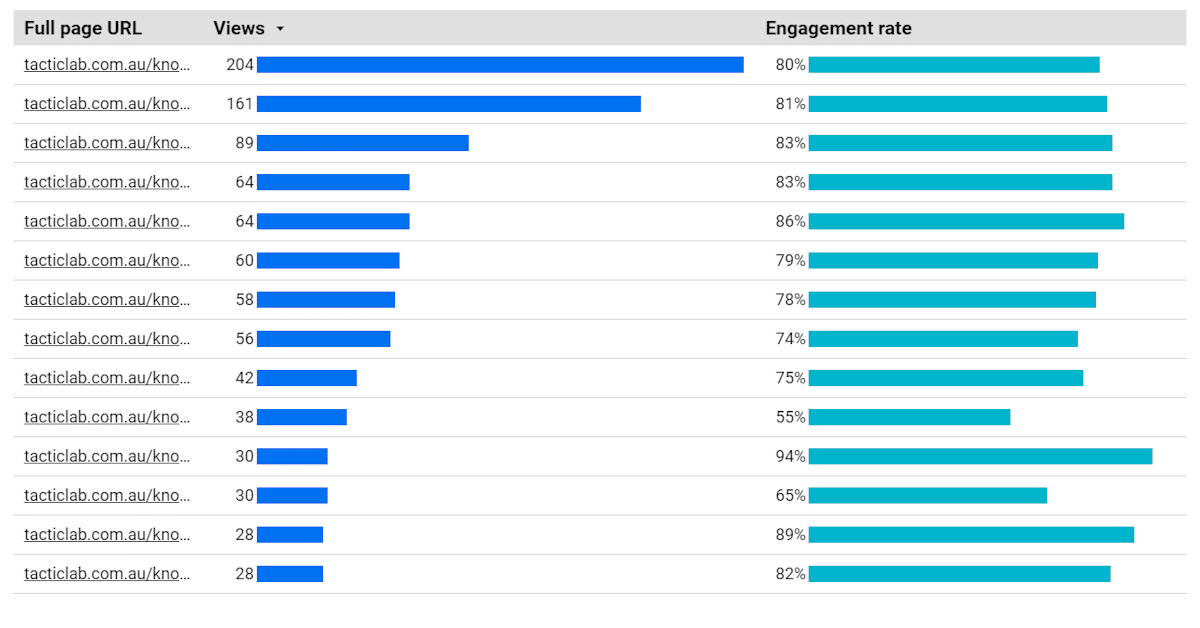
Step 8 – create a table:
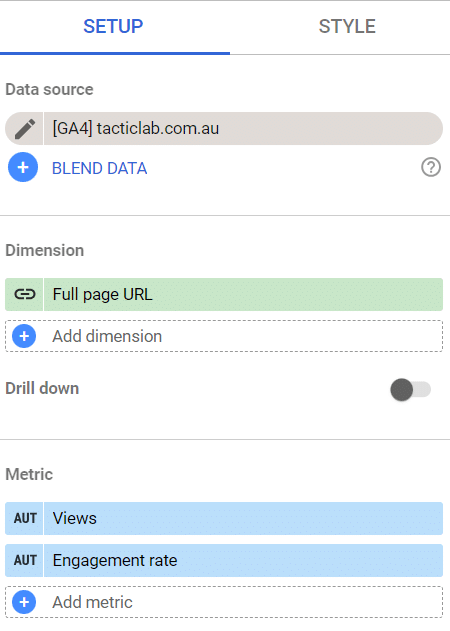
Here we’re showing pageviews (to show the most popular pages first) as well as the engagement rate.
Step 9 – now you have a list of pages with their engagement rate so you can easily spot the website average and which pages overperform/underperform.
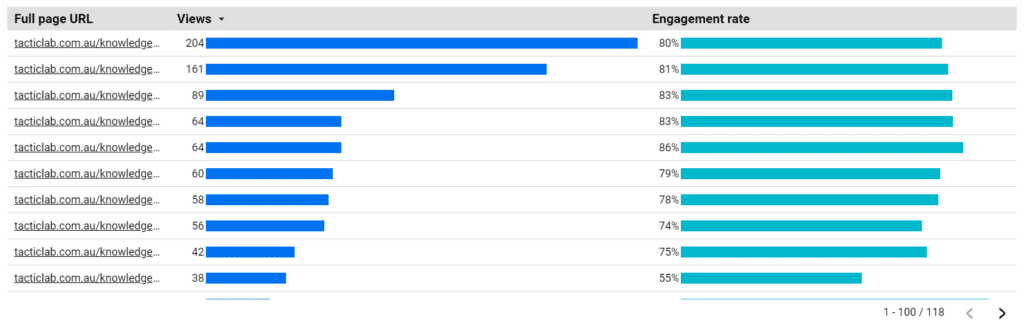
This is just the start of the journey since you may need to perform more analysis to find out why something is over/underperforming, but this will very easily show which pages are probably being read and which ones are just being skimmed.

